TraceHub
Analytics
Time-Series and TraceHub
- Time-Series - Series of observations 𝑥_𝑖, where each observation x corresponds to a specific time t
- TraceHub - Platform where separate analytics and dataset owners can plug in time-series analytics and datasets as APIs
- System runs semi-automated transformer pipelines to generate insights
- Reports usefulness of the generated insights
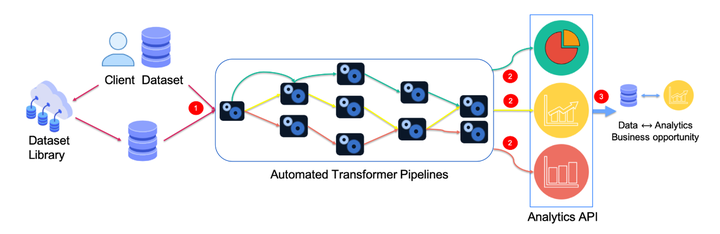
Architecture
- Data Loaders : automatic type detection while loading the data as traces; each trace being sequence of events in time
- Transformer Pipelines : system automates the transformer pipeline by suggesting the applicable ones on the traces; comes with some standard out-of-the-box data transformers like one-hot encoding, missing value, quantiling, binarizing column etc.
- Analytics : after the transformer pipeline is completed, resulting output of traces is fed to analytics which then generates insights along with a usefulness score of it.
Usecase – Simulated Loan Application Dataset
- Loan application types : {medical, vacation, vehicle}
- Events in the application : {receive, evaluate, gather, decision}
- Receive : new application submitted
- Evaluate : agent evaluates the application
- Gather : agent decides to gather additional documents for the application
- Decision : agent approves or denies the application
- TraceHub generates insights on this data
- Code walk-through on below illustrating the 3 steps :
- Data Loading
- Transformer Pipelines
- Insight generation
loader = TabularData()
data = loader.load(data_path="dataset.csv")
setoftraces = TraceSplit().split(data, "appid")

applicable_tfs = [tf for tf in transformers_list if tf.applicable(setoftraces)]
applicable_tfs[i].transform(setoftraces, *args)

analytics = applicable_tf_analytics(setoftraces)
analytics[i].apply(setoftraces)
Shubham Agarwal
Research Software Engineer - AI
Publications
TraceHub - A Platform to bridge gap between State-Of-The-Art Time-Series Analytics and Datasets
(AAAI Best Technical Demo Award!) A platform that connects new non-trivial state-of-the-art time-series analytics with datasets from different domains